Thread Diagnostics - Wait Time
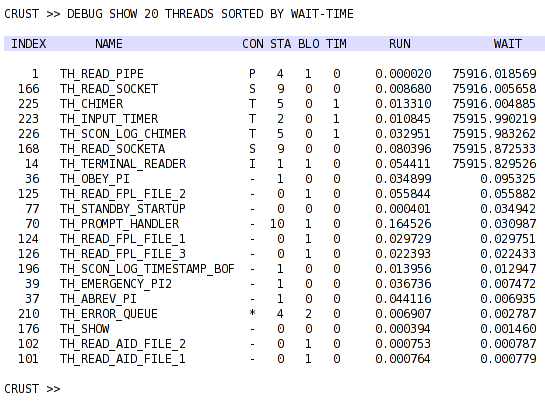
Shown above is an example of how the shell can display the threads that have the highest wait time, ie:- the length of time that they are blocked from running.
This type of data is an invaluable aid to fault finding.
Key to the columns -
INDEX
The index showing where this thread can be found in the thread table.
NAME
The unique name of the thread in the thread table.
CON
The current condition of this thread.
As you would expect the top seven
threads are all waiting for a specific event.
- 'P' - waiting on read from a pipe from another process
- 'S' - waiting on read from a socket from another system
- 'T' - waiting for a timer to expire
- 'I' - waiting for input to be entered on the keyboard
- '*' - waiting to run by the multi-threader shell
- '-' - Currently idle (not waiting or running)
STA
The current state that this thread is processing.
BLO
The number of dynamic data blocks that this thread currently owns.
A thread may only own three blocks (unless it specifically requests more).
TIM
The number of outstanding timers that this thread currently owns.
RUN
The length of time, in seconds, that this thread has run since
the process was started.
WAIT
The length of time, in seconds, that this thread has been
blocked from running since the process was started.
See also Run Time Diagnostics.
Back to our main page